Uploads by NiloferT
Jump to navigation
Jump to search
This special page shows all uploaded files.
| Date | Name | Thumbnail | Size | Description | Versions |
|---|---|---|---|---|---|
| 10:50, 18 May 2012 | Figure 6.jpg (file) |  |
601 KB | 1 | |
| 15:25, 20 May 2012 | Figure 7.jpg (file) |  |
1.47 MB | Reverted to version as of 15:01, 20 May 2012 | 5 |
| 11:10, 18 May 2012 | Figure 8.jpg (file) |  |
1.27 MB | 1 | |
| 11:35, 18 May 2012 | Figure 9.jpg (file) |  |
1.19 MB | 2 | |
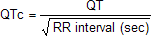
| 23:31, 17 October 2012 | Formule QTc.png (file) | 754 bytes | 1 | ||
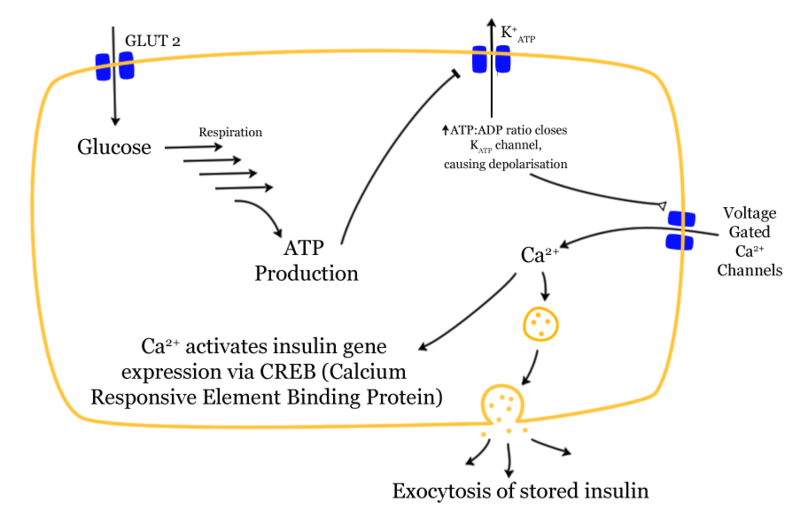
| 22:07, 23 December 2012 | Glucose-insulin-release.png (file) |  |
76 KB | Description: Mechanism of glucose dependent insulin release Date:16 August 2004 (original upload date) Source:Transferred from en.wikipedia Author:Prisonblues | 1 |
| 02:00, 14 July 2012 | Graph.jpg (file) |  |
52 KB | 1 | |
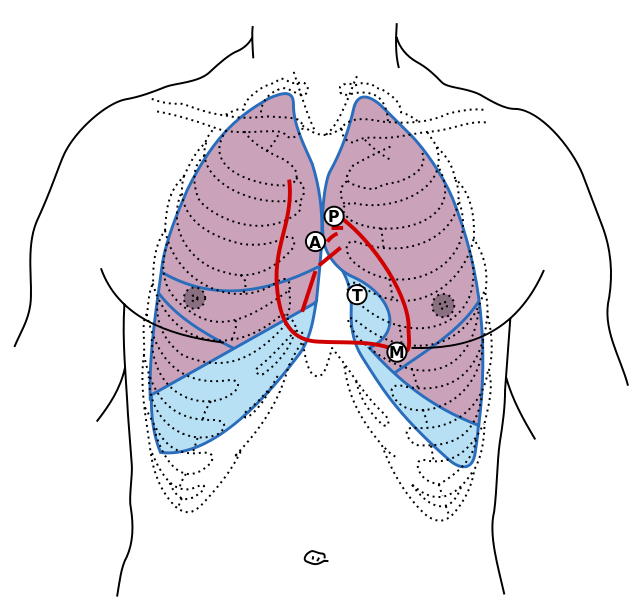
| 15:29, 28 November 2012 | Gray1216 modern locations.svg.png (file) |  |
109 KB | Description: Front of thorax, showing surface relations of bones, lungs (purple), pleura (blue), and heart (red outline). Heart valves are labeled (Mitral (Bicuspid), Tricuspid, Aortic, Pulmonary). Figure 1216 from Gray's Anatomy. It has been updated t... | 1 |
| 04:43, 28 November 2013 | Heart1.JPG (file) |  |
81 KB | 1 | |
| 04:45, 28 November 2013 | Heart2.JPG (file) |  |
84 KB | 1 | |
| 04:46, 28 November 2013 | Heart3.JPG (file) |  |
65 KB | 1 | |
| 21:38, 28 November 2013 | Heart4.JPG (file) |  |
56 KB | 1 | |
| 18:29, 9 October 2012 | Heart bicuspid aortic valve.svg (file) |  |
28 KB | Description: Heart bicuspid aortic valve anatomy Date: 23 December 2006 Author: Patrick J. Lynch, medical illustrator Creative Commons Attribution 2.5 License 2006 | 1 |
| 18:42, 18 October 2012 | Heart lpla echocardiography diagram.jpg (file) |  |
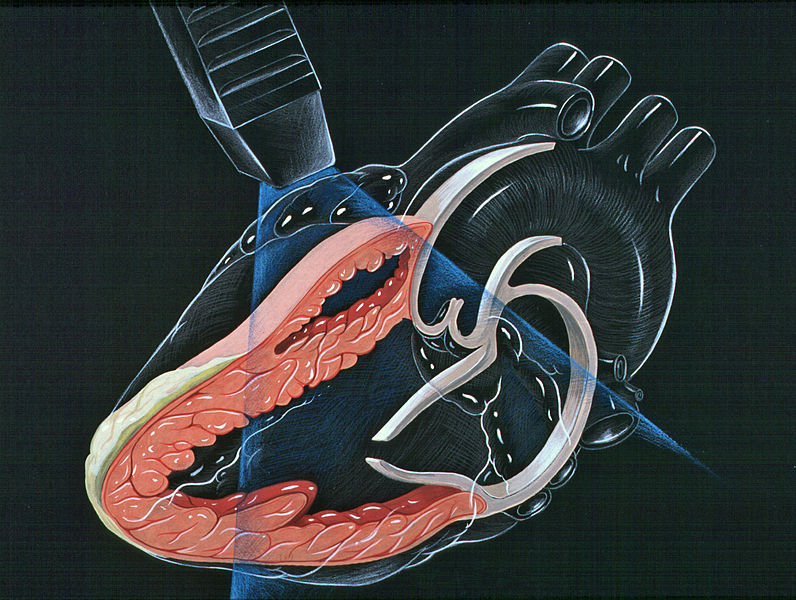
133 KB | Description: Heart normal LPLA left parasternal long axis echocardiography view Date: 23 December 2006 Author: Patrick J. Lynch, medical illustrator | 1 |
| 13:41, 17 January 2013 | Heartfailure.jpg (file) |  |
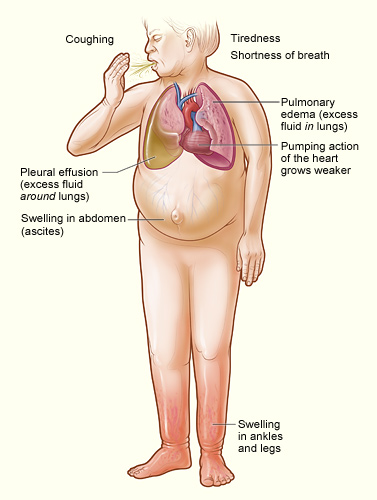
55 KB | Description: The illustration shows the major signs and symptoms of heart failure. Date: Originally uploaded to en.wikipedia on 22 September 2008. Source: http://www.nhlbi.nih.gov/health/dci/Diseases/Hf/HF_SignsAndSymptoms.html; transferred from en.w... | 1 |
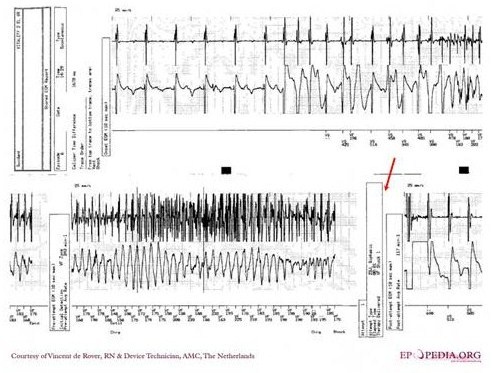
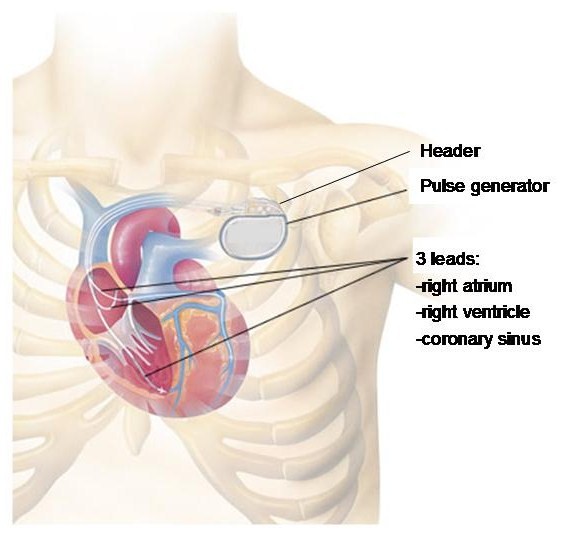
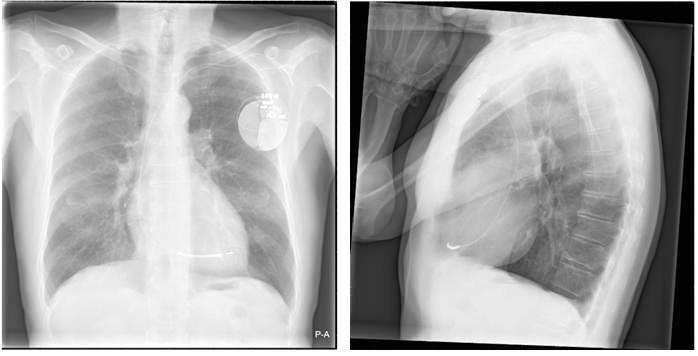
| 02:53, 6 August 2012 | ICD.jpg (file) |  |
67 KB | 1 | |
| 14:56, 28 November 2012 | Jugular Venous Pulse.png (file) |  |
16 KB | Description: The Jugular Venous Pressure Waveform Date:13 December 2011 Author Ecgtocardiology | 1 |
| 18:50, 18 October 2012 | LeftVentricleShortAxis.gif (file) |  |
64 KB | Description: Short axis view of left ventricle of heart Date: 10 July 1999 Source:http://www.yale.edu/imaging/echo_atlas/views/short_axis_lv.html Author: Patrick J. Lynch and C. Carl Jaffe | 1 |
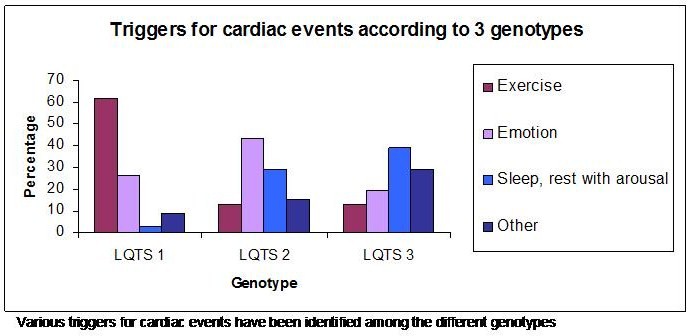
| 13:54, 12 December 2012 | Lqts1.png (file) |  |
417 KB | 2 | |
| 14:04, 12 December 2012 | Lqts2.png (file) |  |
309 KB | 3 | |
| 20:05, 12 December 2012 | Lqts3.png (file) |  |
316 KB | 4 | |
| 00:08, 4 January 2013 | Main symptoms of diabetes.png (file) |  |
863 KB | 2 | |
| 20:04, 4 October 2012 | Myocardi1.jpg (file) |  |
61 KB | 1 | |
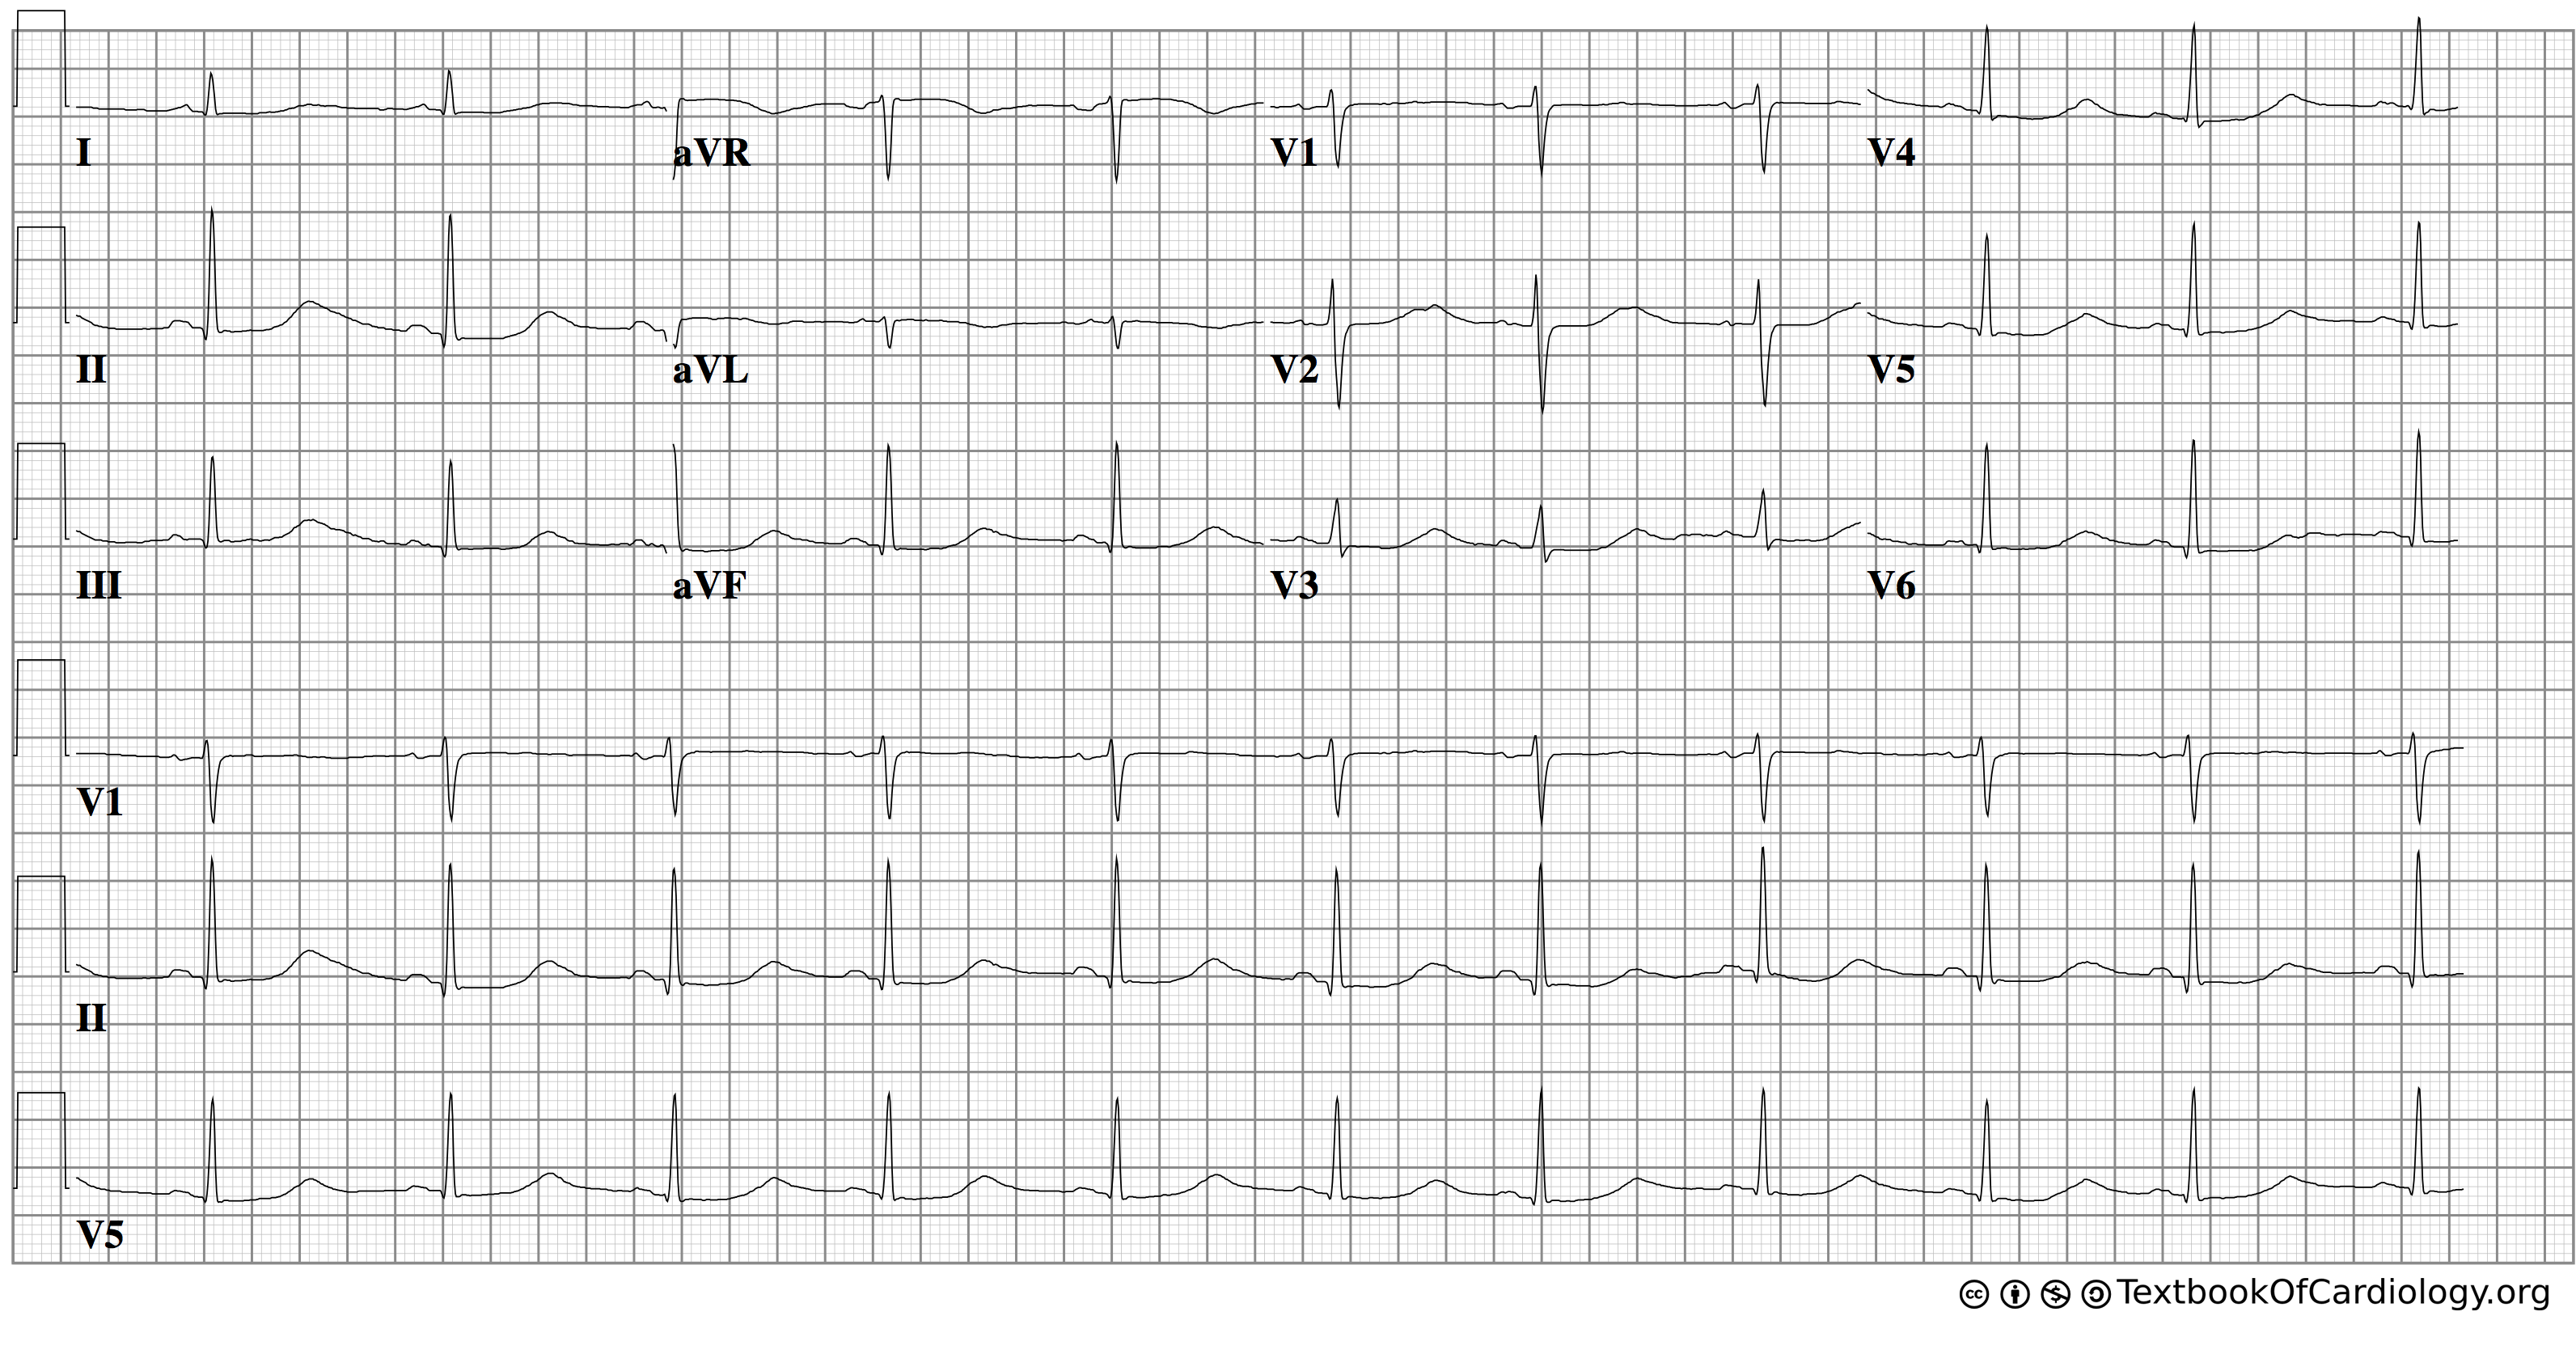
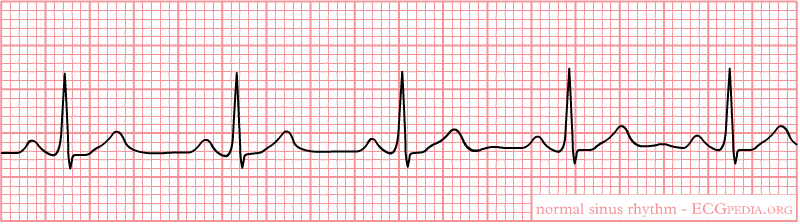
| 23:31, 17 October 2012 | Nsr.png (file) |  |
11 KB | 1 | |
| 04:52, 1 July 2012 | Orthostatic.JPG (file) |  |
25 KB | 1 | |
| 18:41, 29 November 2012 | P1.jpg (file) |  |
13 KB | 1 | |
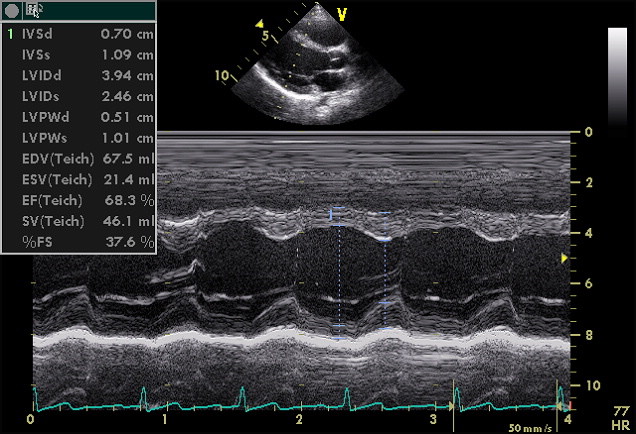
| 18:58, 18 October 2012 | PLAX Mmode.jpg (file) |  |
93 KB | Description: Echocardiogram in the parasternal long-axis view, showing a measurement of the heart's left ventricle Date: May, 2005 Author: Ekko (Uploaded Kjetil Lenes, who made the picture. It is released into the public domain.) | 1 |
| 00:14, 6 August 2012 | Paced2.gif (file) |  |
7 KB | Reverted to version as of 23:31, 5 August 2012 | 3 |
| 04:47, 1 July 2012 | Pathophysiology.JPG (file) |  |
30 KB | 1 | |
| 18:30, 9 October 2012 | Pulmonary valve stenosis.svg (file) |  |
59 KB | Description: The diagram shows a healthy heart and one suffering from Pulmonary valve stenosis. Date: 12 June 2006 Author: Mariana Ruiz LadyofHats | 1 |
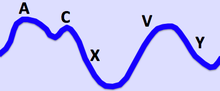
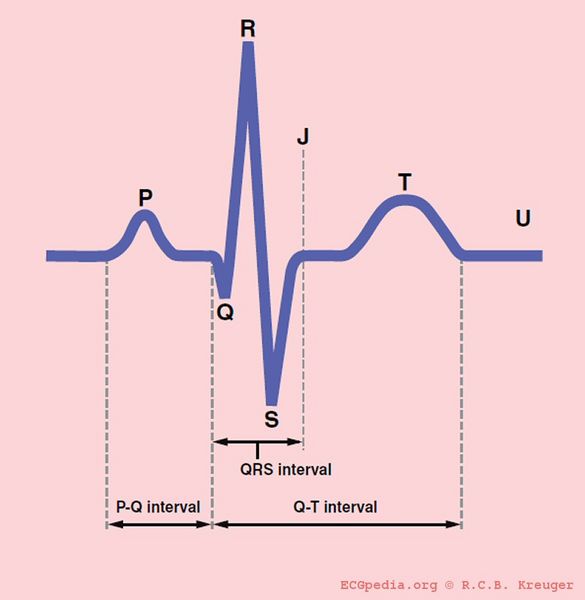
| 18:47, 18 October 2012 | QRSwaves.jpg (file) |  |
20 KB | Description: The different waves and intervals of the ECG (P, PQ, QRS, QT, ST) Date: 2007 Author: Rob Kreuger, medical illustrator, AMC, The Netherlands | 1 |
| 03:35, 6 August 2012 | RedTh.jpg (file) | 31 KB | 1 | ||
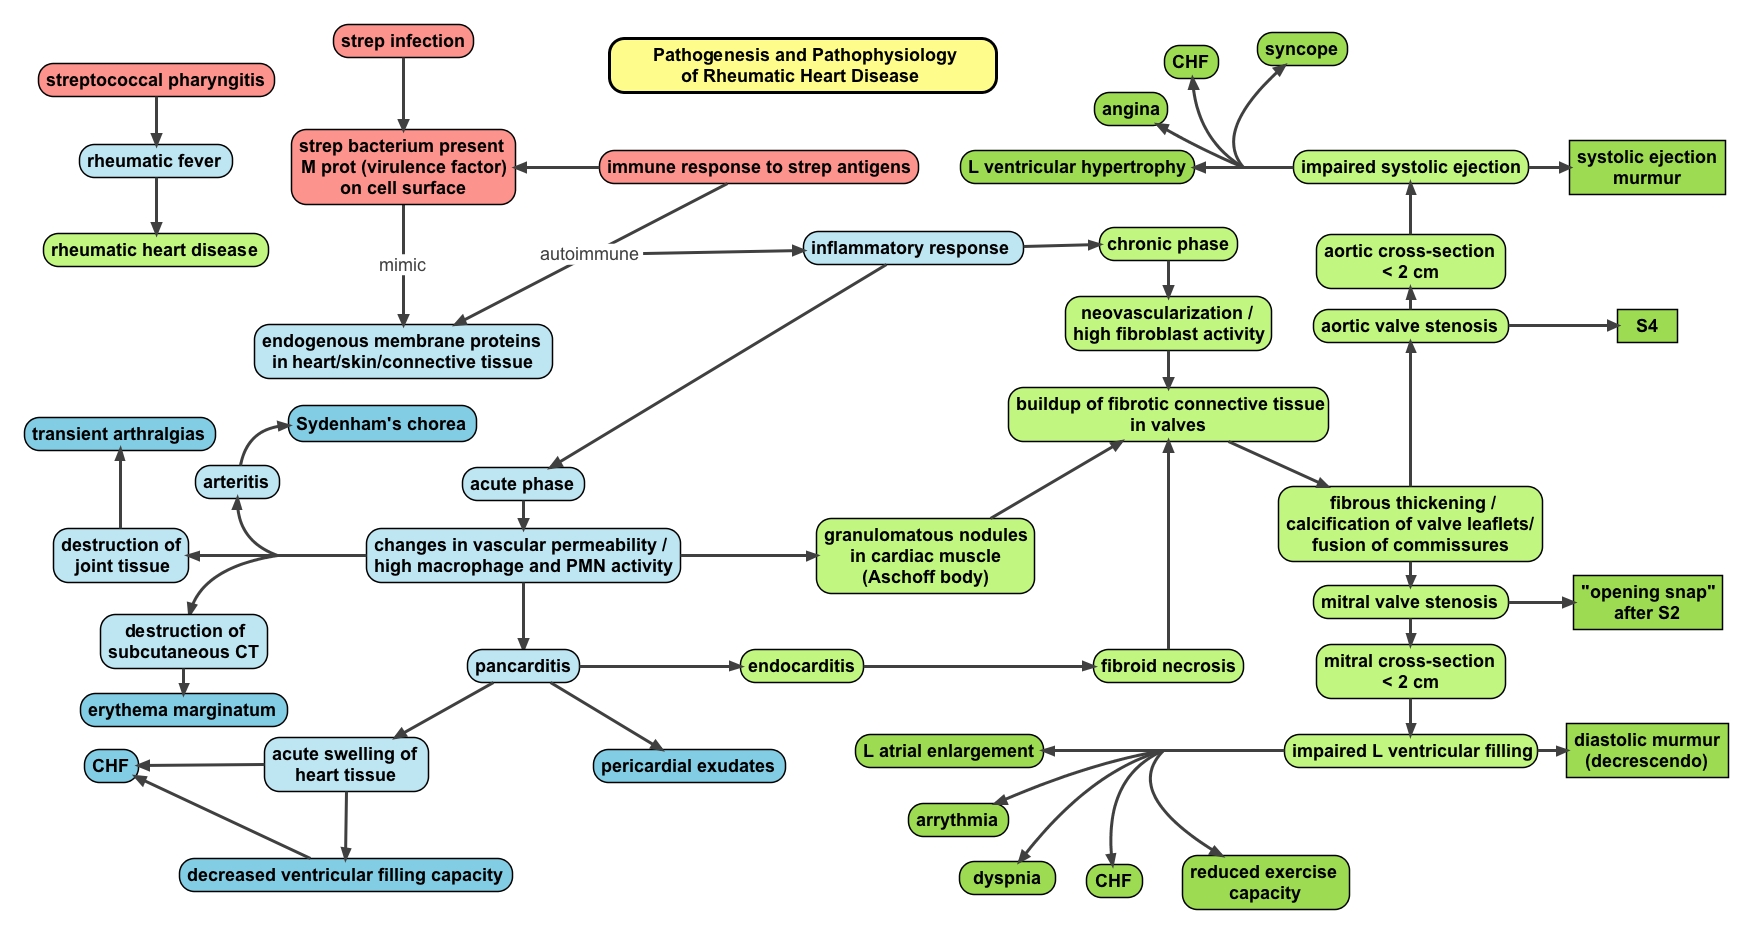
| 15:51, 17 May 2013 | Rheum.heart.disease.jpeg (file) |  |
586 KB | Description: Pathophysiology map of rheumatic fever and rheumatic heart disease. Author: Oxynthes | 1 |
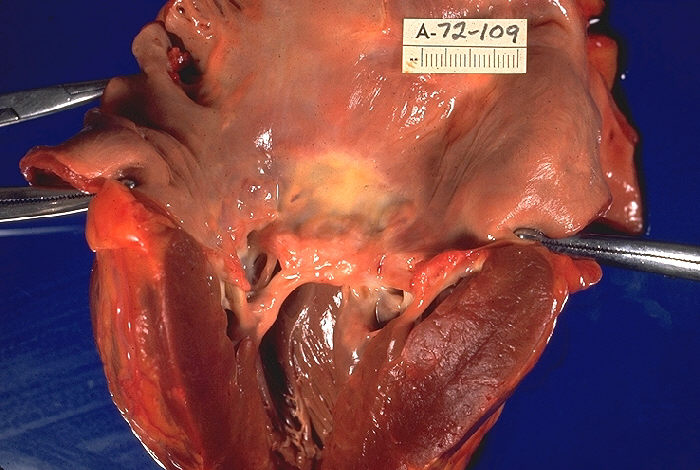
| 15:53, 17 May 2013 | Rheumatic heart disease, gross pathology 20G0013 lores.jpg (file) |  |
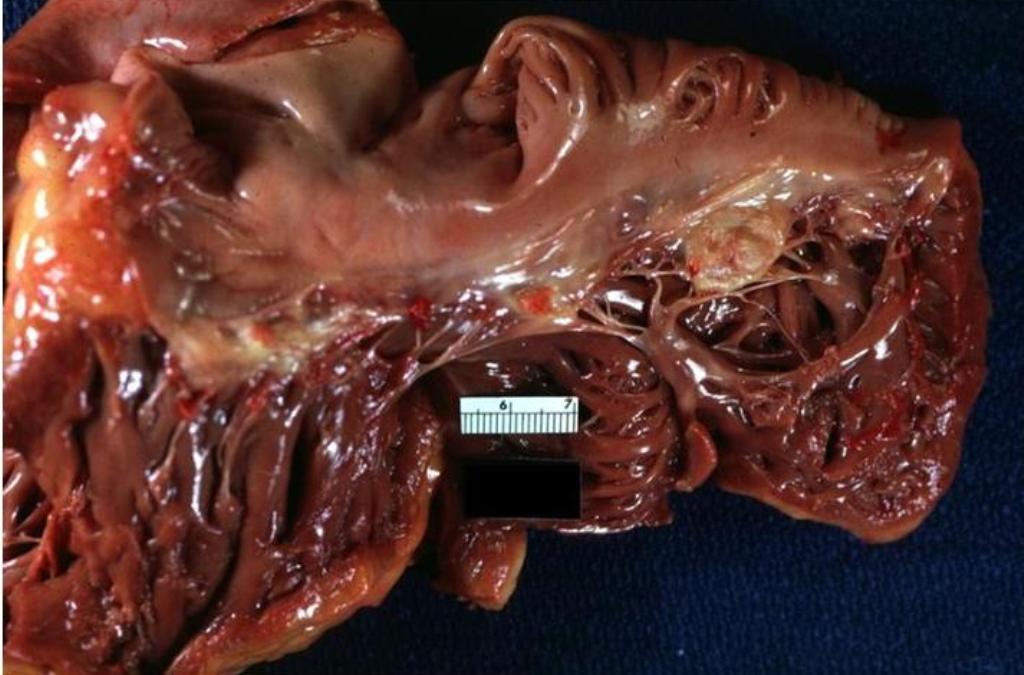
80 KB | Description: "Gross pathology of rheumatic heart disease. Left ventricle has been cut open to display characteristic severe thickening of mitral valve, thickened chordae tendineae, and hypertrophied left ventricular myocardium. Autopsy." Date: 1972 Sou... | 1 |
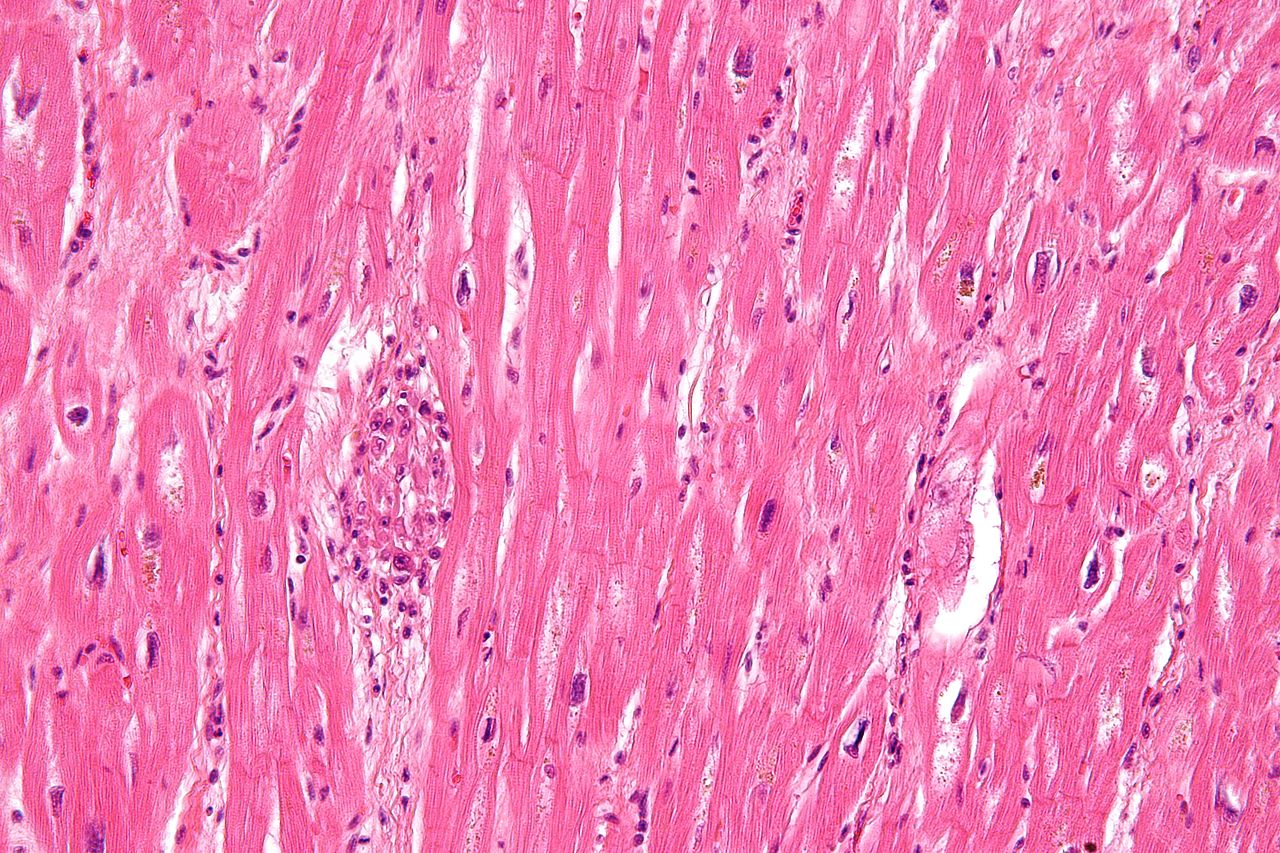
| 18:32, 17 May 2013 | Rheumatic heart disease - 3a - very high mag.jpg (file) |  |
351 KB | Description: Very high magnification micrograph of rheumatic heart disease. H&E stain. It is due to Streptococcus pyogenes. Microscopic findings include Anitschkow cells (also known as caterpillar cells), and Aschoff bodies. Anitschkow cells are though... | 1 |
| 20:38, 17 May 2013 | Rheumatic heart disease world map - DALY - WHO2004.svg (file) |  |
1.45 MB | Description: Age-standardised disability-adjusted life year (DALY) rates from Rheumatic heart disease by country (per 100,000 inhabitants). Source: Vector map from BlankMap-World6, compact.svg by Canuckguy et al. Data from Death and DALY estimates for ... | 1 |
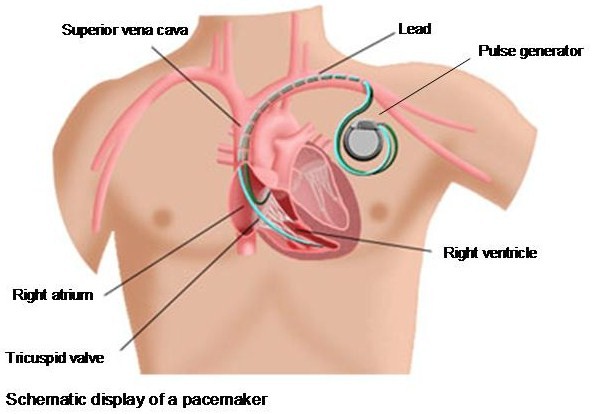
| 22:23, 5 August 2012 | Schematic.jpg (file) |  |
54 KB | 1 | |
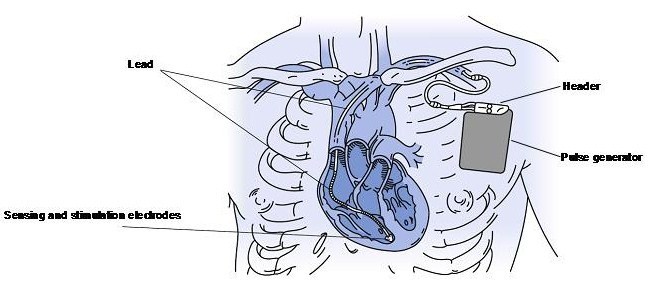
| 17:54, 5 August 2012 | SchematicImg.jpg (file) |  |
50 KB | 2 | |
| 22:47, 5 August 2012 | Schematicpic.jpg (file) |  |
53 KB | 2 | |
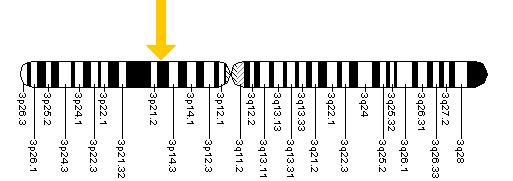
| 09:25, 9 October 2012 | Scn5a.jpg (file) |  |
17 KB | 1 | |
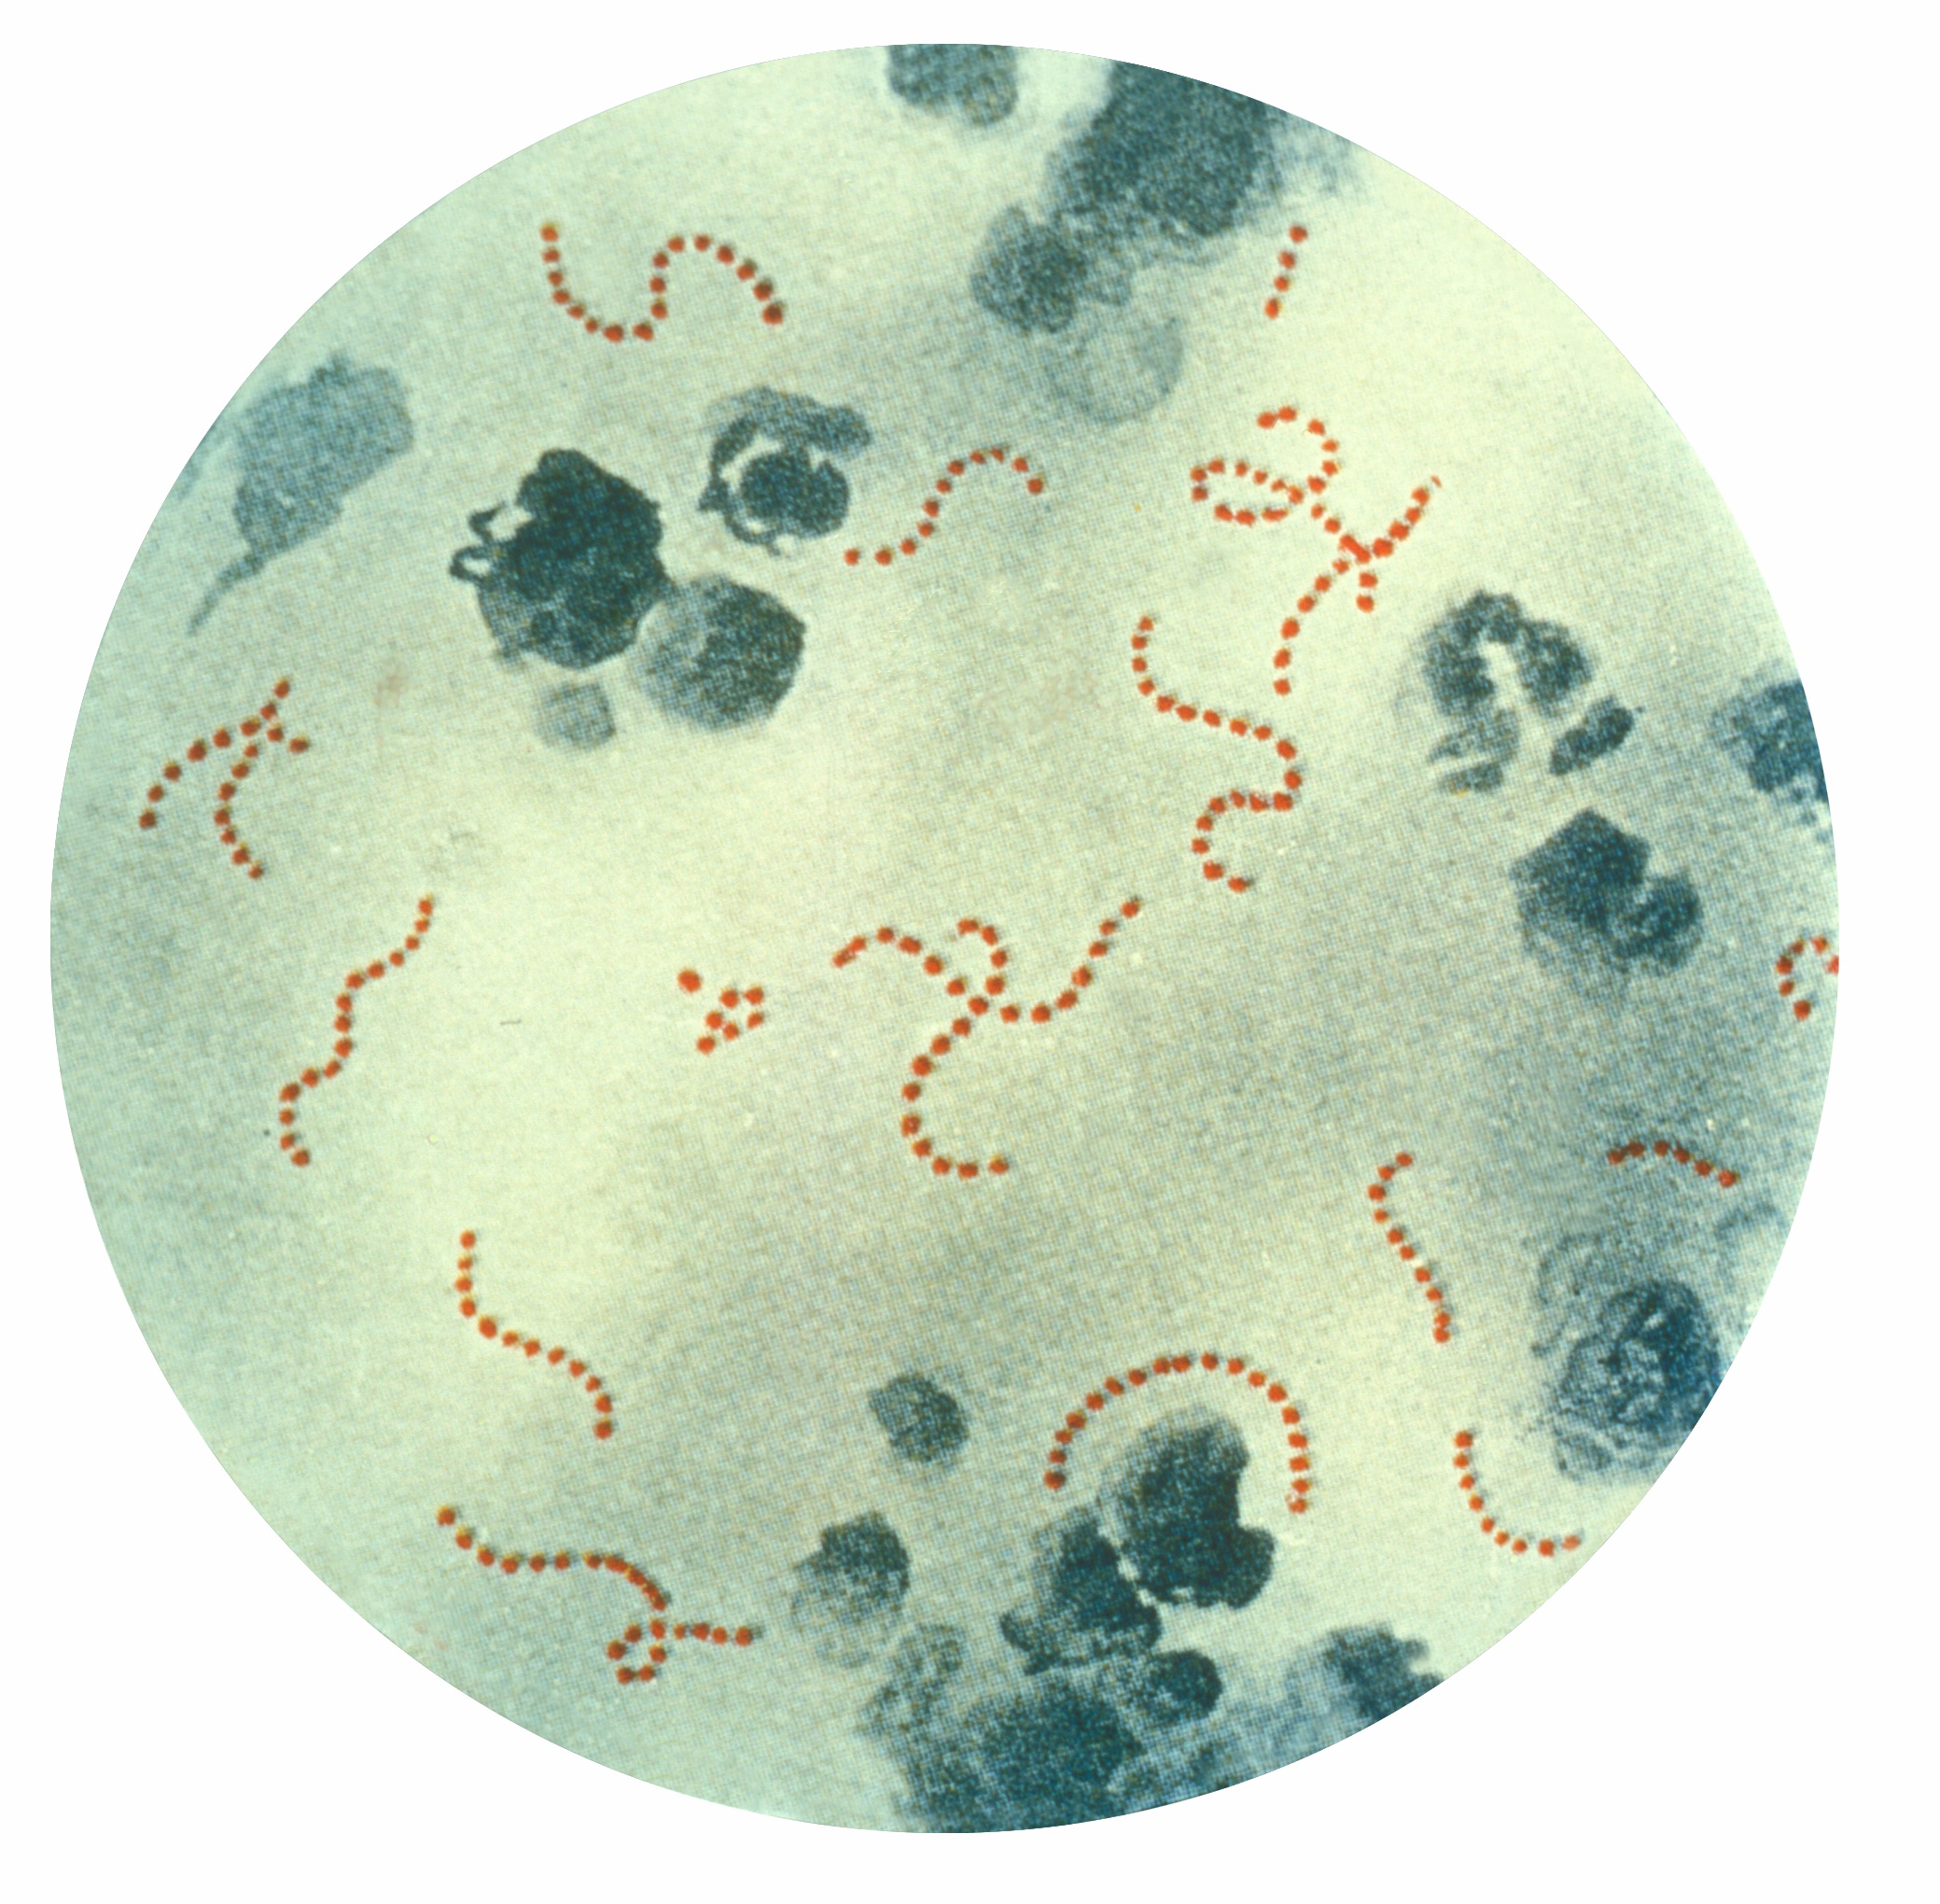
| 16:08, 17 May 2013 | Streptococcus pyogenes 01.jpg (file) |  |
1.01 MB | Description: Photomicrograph of Streptococcus pyogenes bacteria, 900x Mag. A pus specimen, viewed using Pappenheim's stain. Last century, infections by S. pyogenes claimed many lives especially since the organism was the most important cause of puerper... | 2 |
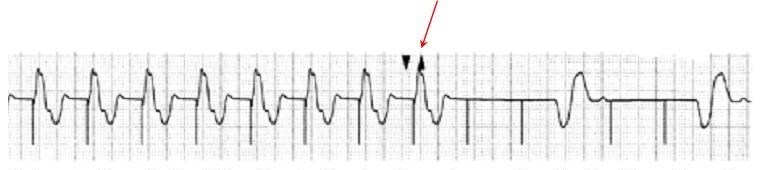
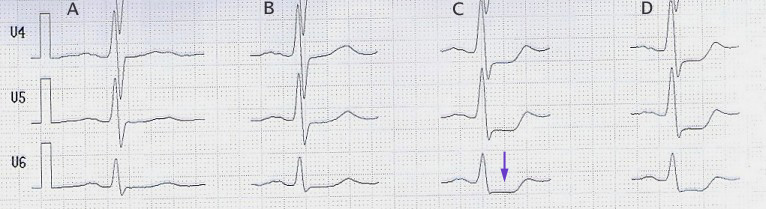
| 23:23, 17 May 2013 | StressECG STDepression.jpg (file) | 72 KB | Description: Belastungs-EKG mit ST-Senkung (Pfeil) ab 100 W (Spalte C) stress-ecg with st-segment-depression (arrow) beginning at 100 W (column C) Date: published 10. Jan. 2006 Source: selbst abgeleitet/own recording Author: J. Heuser JHeuser | 1 | |
| 18:25, 18 October 2012 | Stress test.jpg (file) |  |
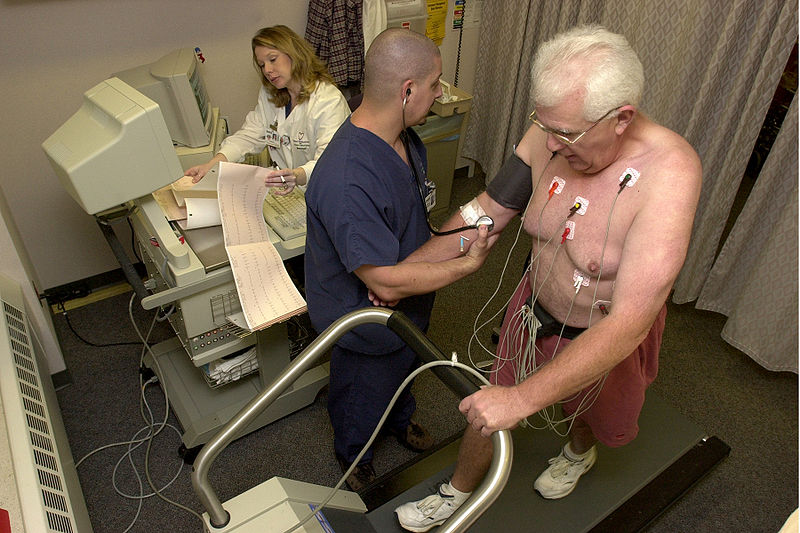
108 KB | Description: Stock footage taken at Beaumont Hospital. 14:18, 28 October 2006(UTC) Date: 2006-10-28 Author: Blue0ctane at en.wikipedia | 1 |
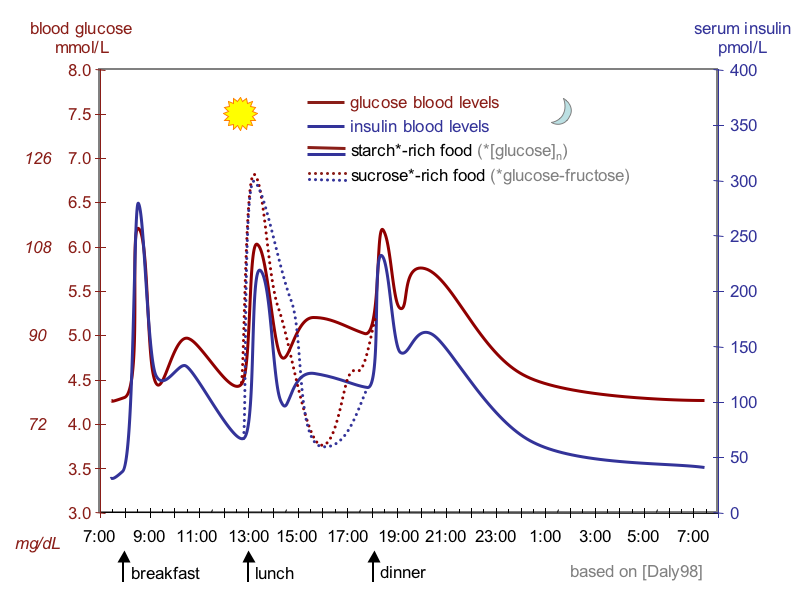
| 21:36, 23 December 2012 | Suckale08 fig3 glucose insulin day.png (file) |  |
80 KB | Description: Idealized curves of human blood glucose and insulin concentrations during the course of a day containing three meals; in addition, effect of sugar-rich meal is highlighted. Source: Solimena Lab and Review Suckale Solimena 2008 Frontiers in... | 1 |
| 03:18, 6 January 2013 | Swe.jpg (file) |  |
57 KB | 3 | |
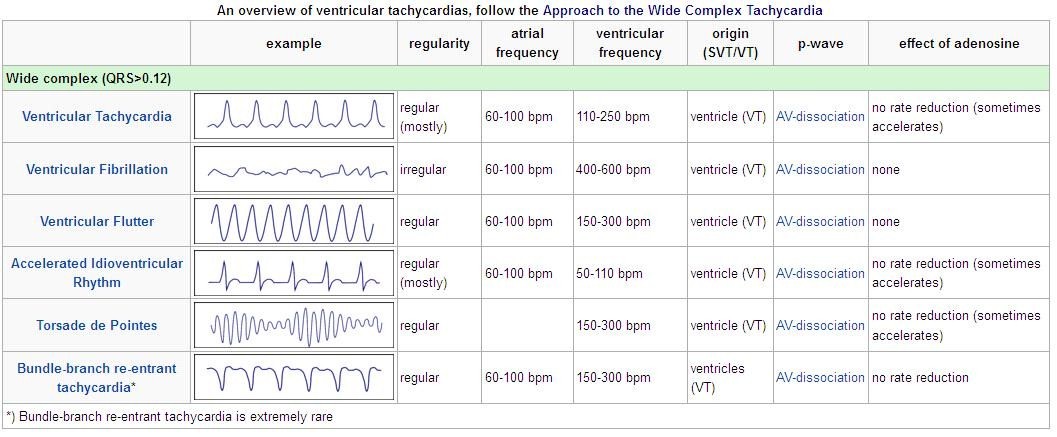
| 20:29, 6 July 2012 | TableVent.jpg (file) |  |
126 KB | 1 | |
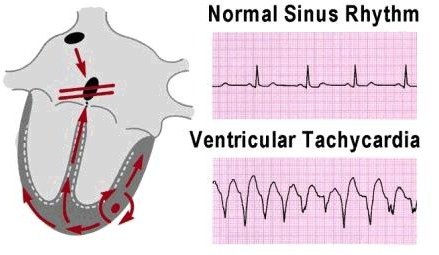
| 19:28, 6 July 2012 | Vent1.jpg (file) |  |
39 KB | 1 | |
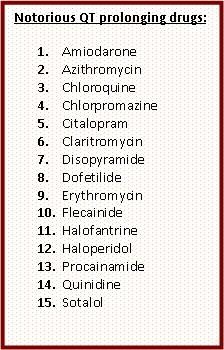
| 20:32, 6 July 2012 | VentDrg.jpg (file) |  |
45 KB | 1 | |
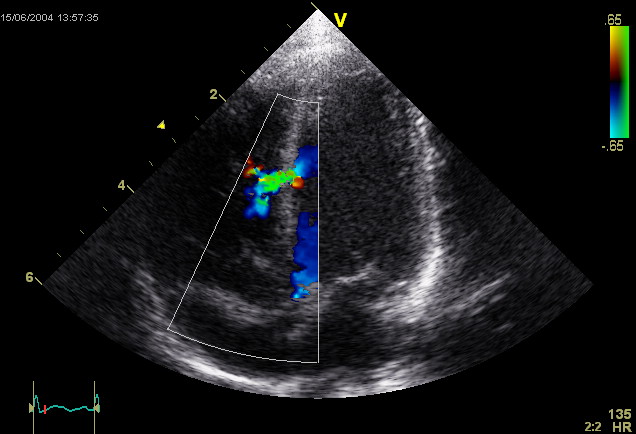
| 23:48, 17 October 2012 | Ventricular Septal Defect.jpg (file) |  |
54 KB | This is an ultrasound picture of the heart, an echocardiogram. It depicts a ventricular septal defect. Author: Kjetil Lenes. | 1 |
| 20:14, 5 August 2012 | Xthorax.jpg (file) |  |
44 KB | 1 |